
Long questionnaires are sometimes cut down to fit the setting they are used in.
A staff survey might be trimmed to reduce survey fatigue, a school or education-technology assessment cut to fit within a lesson, or a twenty-minute tool adapted into a five-minute HR version. When this happens, a high correlation between the short and full versions, such as 0.95, is the kind of number offered as reassurance that the shorter version measures the same thing.
Smith, McCarthy and Anderson (2000) argued that short forms are too often assumed to inherit the full version’s validity. I examined that assumption using Angela Duckworth’s 12-item Grit Scale, testing how well eight-item forms performed and whether the way items were selected made a difference.
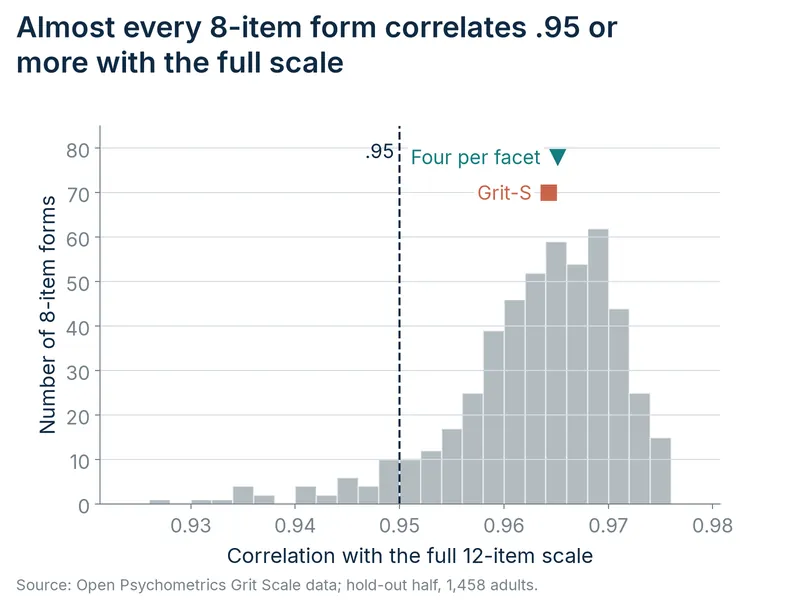
Nearly all eight-item forms correlate at 0.95 or higher with the full scale
I used an exhaustive combinatorial search to evaluate every possible eight-item form of the scale against the original. To keep the test fair, I split the sample in two: one half was used to choose items, and the other half (1,458 participants) was used only to test them.
Looking at the raw correlations, 93% of all possible eight-item forms correlated at 0.95 or higher with the full scale. Even the weakest reached 0.926. The four-per-facet form, which takes four items from each of grit’s two parts, or facets (described below), correlated 0.965 with the full scale (95% interval 0.962 to 0.968). This was almost identical to the Grit-S, the published eight-item form, which reached 0.964 (0.961 to 0.968).
An eight-item form contains two-thirds of the original’s items, so some of that agreement is expected simply because the same items contribute to both scores. The short forms therefore reproduce the original scores very closely. However, a high correlation alone cannot tell us whether they retain the other measurement properties of the full scale.
The rule that kept both facets of grit
Grit is usually described as having two parts, or facets: perseverance of effort, which means working hard and finishing what you start, and consistency of interest, which means sticking with the same goals rather than switching. The full scale has six items for each facet.
To choose items, I used a ranking rule written for this analysis, based on the kinds of evidence used in my 2025 study of a hikikomori risk questionnaire. In the first half of the sample, each item was scored on five statistics: how consistently it orders people in line with the other items (Mokken scalability), how sharply it separates people with more and less grit (its discrimination in an item response model), its share of the information the whole scale gives about grit, how strongly it reflects a single grit factor (its factor loading), and its correlation with educational attainment, an outside criterion, among people aged 25 and over. Each item’s ranks on the five statistics were averaged, so that no single statistic decided the choice. In my 2025 study this evidence was weighed by judgement; writing it down as a fixed rule meant it could be applied before any test results were seen, tested on the other half of the sample, and compared with every other possible form.
I built two eight-item forms from the twelve items, using those rankings. For the first, I took the four highest-ranked items from each facet, so perseverance and consistency were equally represented, as they are in the full scale (six items each). I call this the four-per-facet form. For the second, I took the eight highest-ranked items overall, whichever facet they came from, to see what the statistics would choose without any rule about balance. I call this the unconstrained form.
I also excluded item 10 on content grounds. It concerned reaching a long-term goal, and I judged that, because it records a past achievement, it could partly reflect age and opportunity as well as grit. I made this decision after reviewing the item statistics from the first half of the sample, but before examining the test results. Leaving it out had a small cost, because keeping it would have given the highest reliability of any eight-item form (Cronbach’s alpha of 0.837 rather than 0.820, a difference of 0.017, 95% interval 0.012 to 0.023). It did not change the five main conclusions.
I also checked whether the forms worked in the same way for younger and older respondents, which matters if scores are compared across age groups. This is a measurement invariance analysis, which tests whether people with the same level of grit give the same answers whatever their age group: the model is fitted in steps, each forcing more of the item settings to be identical across three age groups, and the numbers below are the drop in a fit index, the comparative fit index (CFI), at the final step alone, where the items must work identically in every group. Under the main models, the two forms the method chose when item 10 was allowed, both of which include it, showed a larger drop in fit than the full scale did (−0.014 and −0.017, against −0.0099), while the four-per-facet form showed a smaller drop (−0.007) and the Grit-S about the same as the full scale (−0.0091). A larger drop means a form works less consistently for younger and older respondents, although the differences here are small.
The plan’s rule counted a form as working differently only if the CFI fell by 0.010 or more and a second fit index, RMSEA, rose by 0.015 or more. RMSEA never rose by more than 0.007, so no form could meet that rule. On the CFI drop alone (an exploratory reading), the two short forms that include item 10 crossed the 0.010 line commonly attributed to Chen (2007); the full scale and the other short forms did not. No single item showed more than a negligible age effect by effect size, although item 10’s was among the largest of the twelve. In the ordered-category check, which treats the answers as ordered categories rather than evenly spaced numbers, no form’s fit dropped across age groups, so the age result should be treated with caution.
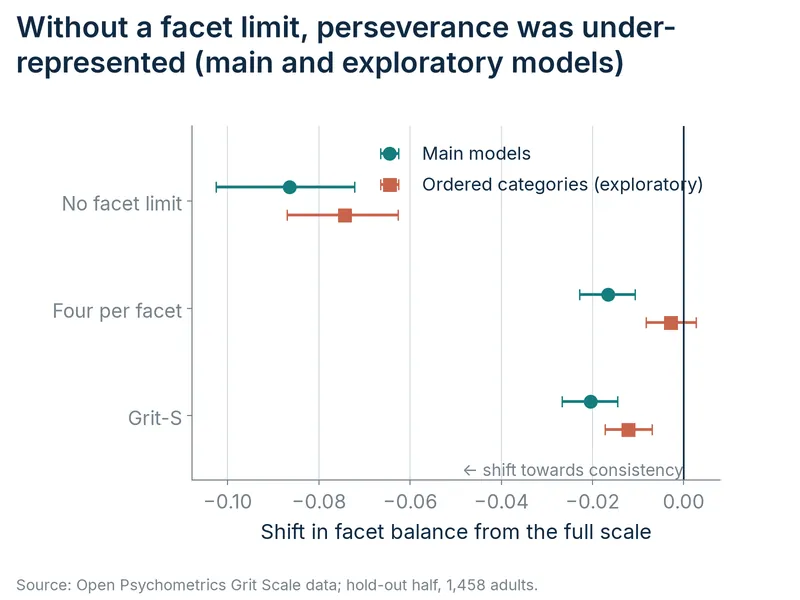
The unconstrained form ended up with five consistency items and only three perseverance items. That matters because the total score is meant to combine both facets of grit. In the full scale, each facet has six items, so both contribute roughly equally, although even there the total tracks consistency slightly more (0.858 against 0.824). With more consistency items, the unconstrained form’s score depends more on how consistent someone’s interests are, and less on how much they persevere.
To put a number on this, I used a factor model of how all twelve items relate to the two facets of grit (perseverance and consistency). From it, I worked out two correlations for each short form and for the full scale: how strongly its total score relates to perseverance, and how strongly it relates to consistency. The gap between the two shows which facet the score favours. I then compared each short form’s gap with the full scale’s. A value of zero means the short form has the same balance as the full scale. A positive value means it favours perseverance more than the full scale does, and a negative value means it favours consistency more. The further from zero, the bigger the shift. Keep in mind that the unconstrained form had five consistency items and three perseverance items. On this measure, the unconstrained form shifted the balance by −0.086 (95% interval −0.103 to −0.072) compared with the full scale. The four-per-facet form shifted the balance by −0.017 (−0.023 to −0.011), and the Grit-S, which also has four of each, by −0.020 (−0.027 to −0.015). Put simply, the unconstrained form’s score reflects consistency noticeably more than the full scale’s does. The shift is modest in size, but it is much larger than the four-per-facet form’s (−0.086 compared with −0.017).
The unconstrained form also showed a weaker relationship with openness to experience, one of the Big Five personality traits. The correlation was 0.061 lower than that of the full scale (95% interval 0.046 to 0.076). The results here do not show why. In practice, grit’s link with openness was already very small on the full scale (0.062, 95% interval 0.007 to 0.114) and all but disappeared on the unconstrained form (0.001, −0.055 to 0.054), so a study using that form would be less likely to detect it.
The four-per-facet form retained both facets about as well as the full scale. Every consistency item was worded negatively and every perseverance item positively, so this analysis cannot establish whether the selection rule preserved the two facets themselves or the original balance of positive and negative wording.
The main models treat the five answer options as evenly spaced numbers. Answer options are really ordered categories, so the distances between them are not guaranteed to be equal. Treating them as evenly spaced numbers is a simplification. One simulation study found it acceptable with five or more options under some conditions, such as small samples and answers spread roughly evenly around the middle option, but found that treating answers as ordered categories estimated how strongly each item reflects its factor more accurately (Rhemtulla, Brosseau-Liard and Savalei, 2012). So it is still an approximation. The exploratory ordered-category check treats the answers as ordered categories instead. Running both analyses shows whether a result depends on that approximation: a finding that appears under both is robust, and one that appears under only one is fragile. The unconstrained form’s shift towards consistency appeared under both (−0.086 in the main models; −0.074 in the exploratory ordered-category check, 95% interval −0.087 to −0.063), so that finding is robust. The four-per-facet form’s slight shift appeared only in the main models (−0.017, 95% interval −0.023 to −0.011, which excludes zero); in the exploratory ordered-category check it was −0.003 (95% interval −0.008 to 0.003), which includes zero. The two estimates’ intervals do not overlap, although the gap between them was not formally tested, so that shift is fragile and too small to rely on. Even under the main models, the four-per-facet form’s balance between the two facets stayed close to the full scale’s. In my view, a shift this small is unlikely to matter for most uses.
The two balanced short forms (those with equal numbers of perseverance and consistency items), the four-per-facet form and the Grit-S, were slightly more similar to conscientiousness, one of the Big Five personality traits, which already overlaps considerably with grit. Their scores were a little more strongly related to conscientiousness than the full scale’s were, so they were slightly harder to tell apart from it. For the four-per-facet form, the correlation between grit and conscientiousness, estimated at the level of the underlying traits, which removes measurement error, rose from 0.755 with the full scale to 0.787, an increase of 0.032 (95% interval 0.021 to 0.045). For the Grit-S, it rose to 0.779, an increase of 0.024 (95% interval 0.013 to 0.037). Both increases are small next to how strongly the two traits are already related. In practice, the balanced short forms become slightly less distinct from conscientiousness, which matters mainly for research asking whether grit adds anything beyond conscientiousness. In my view, for most everyday uses the change is likely to be negligible.
The correlation between grit and conscientiousness showed no clear change for the unconstrained form under the main models (−0.003, 95% interval −0.013 to 0.008), and a slight increase in the exploratory ordered-category check (0.009, 95% interval 0.001 to 0.018). The two intervals overlap, and the difference between the estimates was not formally tested. These shifts were small compared with the existing overlap between grit and conscientiousness.
At eight items, choosing items by their statistics gave little advantage over a typical form
I compared the four-per-facet form with all 495 possible eight-item forms on the five criteria set out in the plan: its raw correlation with the full scale; its correlation with the four items it leaves out, corrected for measurement error; its reliability (Cronbach’s alpha, which indicates how consistently the items hang together); how closely it reproduces the full scale’s correlations with the Big Five personality traits; and its correlation with educational attainment among people aged 25 and over. For each criterion, the comparison gives the share of the other forms that the four-per-facet form beats, so 50% is the middle, and a form counts as clearly above the middle only when the whole 95% interval for that share is above 50%. The four-per-facet form beat more than half of the other forms on four of the five criteria, but was clearly above the middle on only two: reliability, and the correlation with the left-out items, which cannot be interpreted in this analysis (the full report gives the reason). So, with eight of the twelve items kept, choosing items by their statistics gave little advantage over a typical form, except for higher reliability.
This result needs some caution, because the method I used to choose items favours items that correlate strongly with each other, which raises reliability almost by design. High reliability is not always a good sign in a short form. Items that correlate very strongly may simply be asking the same thing in slightly different words, so a form built only for reliability can end up covering a narrower slice of what it is meant to measure. Good item selection balances the statistics against content, keeping items that each capture a different part of the construct, which is what the four-per-facet rule was there to protect.
The choice of items matters more as a form gets shorter, at least on the raw correlation. The best four-item form correlated 0.912 with the full scale and the worst 0.716. At eight items, the corresponding figures were 0.972 and 0.945. These best and worst forms were chosen in the first half of the sample, using their correlation with the full scale after removing the measurement error they share with it, and then scored on the raw correlation in the second half. That is why the worst eight-item form here (0.945) is not the lowest figure reported earlier (0.926).
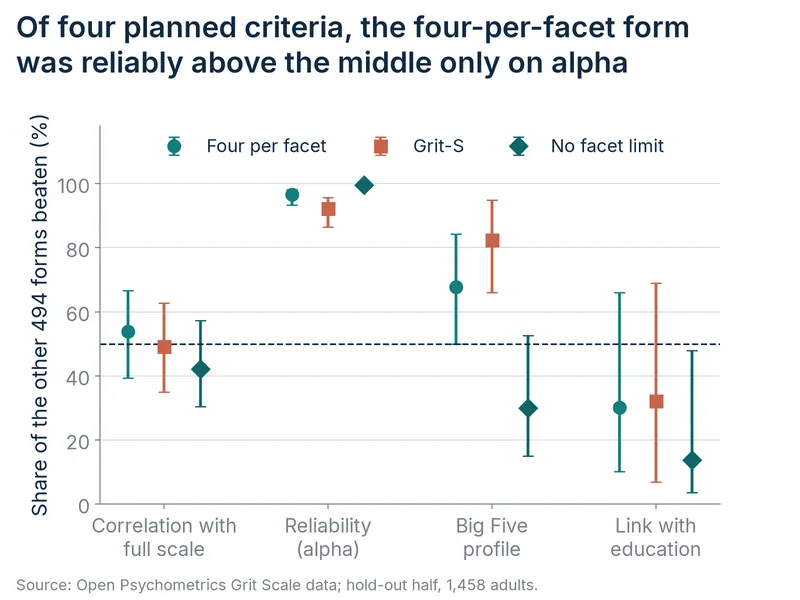
The four-per-facet form shared seven of its eight items with the published Grit-S, and the two performed almost identically across the evaluation criteria. The only small advantage was in reliability, where the four-per-facet form’s Cronbach’s alpha was 0.008 higher (95% interval 0.002 to 0.015).
I also looked, in an exploratory analysis, at how well the short form picked out people at the top of the grit distribution. In this exploratory analysis, of those in the top 10% on the full scale, 74% were also in the top 10% on the four-per-facet form (95% interval 67% to 81%), so roughly one in four top scorers would be missed. A typical eight-item form, the median of all combinations, achieved 79%. That is slightly higher, but it falls within the four-per-facet form’s interval, so the two are not clearly different. The selected form simply offered no advantage on this measure.
To check that the results were not flattered by testing items on the same people used to choose them, I selected the items in one half of the sample and evaluated them in the other. The four-per-facet form’s raw correlation with the full scale was the same in both halves, so on this measure, the way the items were chosen did not inflate the result.
What else changes when you shorten
A shorter scale also measures less precisely, because there are fewer answers to go on. Using an exploratory item response model (a graded response model, which estimates how much information each item gives at each level of grit), I compared how precisely the four-per-facet form and the full scale measure people. Each answer narrows down where someone stands on grit, so with fewer items there is less to go on. In this exploratory analysis, for someone with average grit, the four-per-facet form pinned down their level about 84% as well as the full scale (95% interval 81% to 86%). For someone with very low grit, two standard deviations below average (about the lowest 2% of people), this fell to 78% (95% interval 75% to 81%). In everyday terms, scores on the four-per-facet form carry a little more uncertainty than on the full scale, and the loss is larger for people low in grit. So the four-per-facet form measures low scorers less precisely, which matters most if scores are used to make decisions about individuals.
When people are ranked by their grit scores, shortening the scale can change where they fall in that ranking. Of those who scored in the top quarter on the full scale, 87% also fell in the top quarter on the four-per-facet form (95% interval 83% to 90%). In other words, around one in eight would no longer be classified among the highest-scoring individuals. This matters when short forms are used to rank, screen or select people.
The choice of form also changed how the evidence about gender differences was interpreted. A Bayes factor compares how well two explanations fit the data. On the full scale, the data were about four times more likely if men and women do not differ in grit than if they do, a Bayes factor of about 4.3:1 in favour of no difference (BF₀₁ ≈ 4.3). Values between 3 and 10 are usually described as moderate evidence, and values between 1 and 3 as anecdotal (a common convention; Lee and Wagenmakers, 2014, as set out in Wagenmakers et al., 2018), so this is moderate evidence of no difference. On the four-per-facet form, the evidence flipped to moderate support for a small difference, with women scoring slightly higher (about 6.3:1; BF₁₀ ≈ 6.3). On the Grit-S, the evidence still favoured no difference, but only anecdotally (about 2.9:1; BF₀₁ ≈ 2.9). These gender results use both halves of the sample, covering the 2,898 people who reported their gender as male or female.
On the four-per-facet form, the estimated difference between men and women moved by only about 0.05 of a standard deviation towards women scoring higher, compared with the full scale (exploratory; 95% interval 0.03 to 0.07). That is about a twentieth of the typical spread in grit scores. It changed the conclusion only because the full-scale result was already sitting close to the line between evidence for no difference and evidence for a small one.
Limitations of this analysis
Participants completed all 12 items in one sitting, and the short forms were scored from those same responses. On its own, a short form might produce different answers, because how people respond to a question can depend on the questions around it. A separate study, giving people only the short form, would be needed to establish whether, and by how much, agreement changes.
The sample was also relatively young (median age 24), around two-thirds women and approximately half from the US. Everyone had visited a personality-test website and completed the questionnaire without anything at stake. We therefore cannot assume these findings would transfer directly to workplaces or schools.
The item-selection method did not produce a clearly better form than the published Grit-S. Their performance was almost identical. The scale’s author also recommends using the full 12-item version and discourages using grit scores in high-stakes decisions, such as admissions or hiring.
In one study of eighth-grade pupils, those attending oversubscribed charter schools rated themselves lower on grit despite achieving more highly. The authors suggested that responses might partly reflect the standards and expectations of the people around them (West et al., 2016).
A reflection on my own work
My 2025 study of a hikikomori risk questionnaire also found a near-perfect correlation between its short and full versions. As with the Grit Scale, some of that agreement may have been driven by the items shared between the two versions. However, the HRI-13, the 13-item short form of the Hikikomori Risk Inventory (HRI-24), was also tested against a range of external measures, retaining very similar relationships to the full questionnaire across measures of anxiety, depression, coping and shame. These similar correlations are partly expected for the same reason, since the two versions share items. In a second study in the same paper, in which participants completed only the short form, it also showed a moderate relationship with modern-type depression, which remained even after the depression subscale was removed. Because those participants never saw the full questionnaire, this result cannot be an artefact of shared items, which adds evidence that the short form still shows the expected relationship when it is answered on its own.
A short checklist for any short assessment
-
Treat a high correlation between a short form and the full scale as weak evidence, especially when the short form’s items are part of the full scale. Look instead for evidence that it keeps the full scale’s balance and its relationships with other measures.
-
Check that every part of what the full scale measures is still there in the short form, in roughly the same balance.
-
Ask whether the short form was tested on people who answered only the short form. Scoring it from full-scale answers can flatter it, because how people answer can depend on the questions around them.
-
If the short form will be used to sort or select individuals, ask how many people would change group. A high correlation can hide this: here, about one in eight of the top quarter on the full scale fell out of it on the short form.
-
If the short form will be used to compare groups, check whether the conclusion about those groups changes depending on which form is used. Here, a tiny shift was enough to flip the conclusion about gender.
About this analysis
Declaration of interest: this analysis tests the item-selection method I used in my own published work (Gorman et al., 2025). The plan, the selection rule and the criteria were fixed in advance, with any departures explained in the full report.
The data are the Open Psychometrics Project’s file of answers to the 12-item Grit Scale and a 50-item Big Five questionnaire, dated 2015: 4,270 respondents in the raw file, of whom 2,916 adults with complete grit answers passed the data-quality checks. Items are referred to by number. The full report, code and data sources are available on request.
Sources: Chen, F. F. (2007), Sensitivity of goodness of fit indexes to lack of measurement invariance, Structural Equation Modeling, 14(3), 464–504. Duckworth, Peterson, Matthews and Kelly (2007), Journal of Personality and Social Psychology, 92(6), 1087–1101. Duckworth and Quinn (2009), Development and validation of the Short Grit Scale (Grit-S), Journal of Personality Assessment, 91(2), 166–174. Duckworth, A., Research measures and scales, angeladuckworth.com/measures. Gorman, Bacon, May and Minton (2025), Hikikomori Risk in the UK, International Journal of Social Psychiatry, 71(8), 1621–1632. Lee and Wagenmakers (2014), Bayesian Cognitive Modeling: A Practical Course, Cambridge University Press. Rhemtulla, Brosseau-Liard and Savalei (2012), When can categorical variables be treated as continuous? A comparison of robust continuous and categorical SEM estimation methods under suboptimal conditions, Psychological Methods, 17(3), 354–373. Smith, McCarthy and Anderson (2000), On the sins of short-form development, Psychological Assessment, 12(1), 102–111. Wagenmakers et al. (2018), Bayesian inference for psychology. Part II: Example applications with JASP, Psychonomic Bulletin & Review, 25(1), 58–76. West, Kraft, Finn, Martin, Duckworth, Gabrieli and Gabrieli (2016), Educational Evaluation and Policy Analysis, 38(1), 148–170. Open Psychometrics Project, openpsychometrics.org/_rawdata.