
Every month, NHS patients are asked one question: “Overall, how was your experience of our service?” The answers to this Friends and Family Test (FFT) appear in hospital reports, board papers and press releases. Looking at the August 2026 data in October, I noticed that hospitals that collected feedback by text message seemed to score lower.
One month can mislead. So I set up a proper test, using twelve months of data I had not seen. That meant over two million inpatient ratings from 133 NHS acute trusts in England, August 2025 to July 2026. The scores were also checked against an independent measure, the national inpatient survey from the Care Quality Commission (CQC).
1. Almost every hospital scores in the 90s
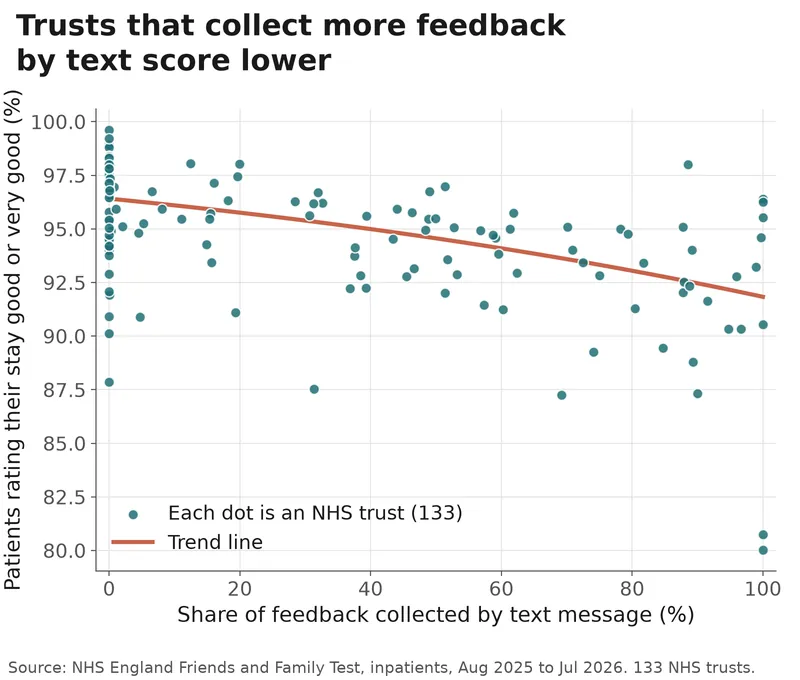
The FFT score is the percentage of patients rating their stay “good” or “very good”. The typical trust scored 94.9%, and 123 of the 133 trusts scored 90% or more. When scores are this close together, small differences can move a hospital a long way up or down a ranking.
2. Trusts that collect more feedback by text score lower
Trusts choose how to collect FFT feedback: paper cards or tablets on the ward, forms at discharge, online, or a text message after the patient gets home. Over the year, 36.9% of all responses came by text, but trusts varied widely, from 23 that collected 80% or more by text to 39 that used no text at all.
The pattern from that single month held across the twelve months. Each 10-point increase in the share of a trust’s responses collected by text was linked to an FFT score about half a point lower (0.48 points, 95% interval 0.34 to 0.62). This is after allowing for region, trust size and specialist hospitals. A separate comparison, also allowing for region, trust size and specialist hospitals, found that trusts collecting 80% or more by text scored about 5 points lower than those collecting 20% or less (95% interval 3.3 to 6.9). In alternative versions of this comparison, some without these adjustments, the gap between the high-text and low-text groups ranged from about 2.6 to 5.6 points, depending most on how the groups were drawn. Trusts collecting more by text had fewer “very good” ratings and slightly more “poor” or “very poor” ones.
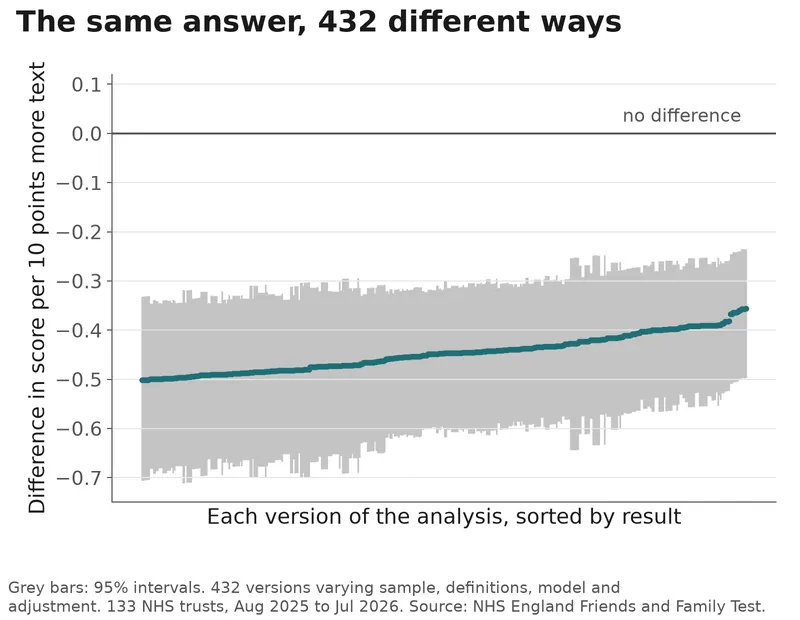
Any analysis involves judgement calls, such as which trusts to include, how to handle unusual data and which statistical model to use. To check whether these choices changed the finding, the analysis was repeated 432 times, once for each combination of reasonable alternatives (a multiverse analysis). For example, some versions left out specialist hospitals or the few trusts with the most influence on the result, some used a different statistical model, and some handled months with unusual data differently. The direction was the same in every version. Across the versions, estimates ranged from 0.36 to 0.50 points lower in the FFT score for every 10 points more of feedback collected by text.
3. The national survey does not show the same gap
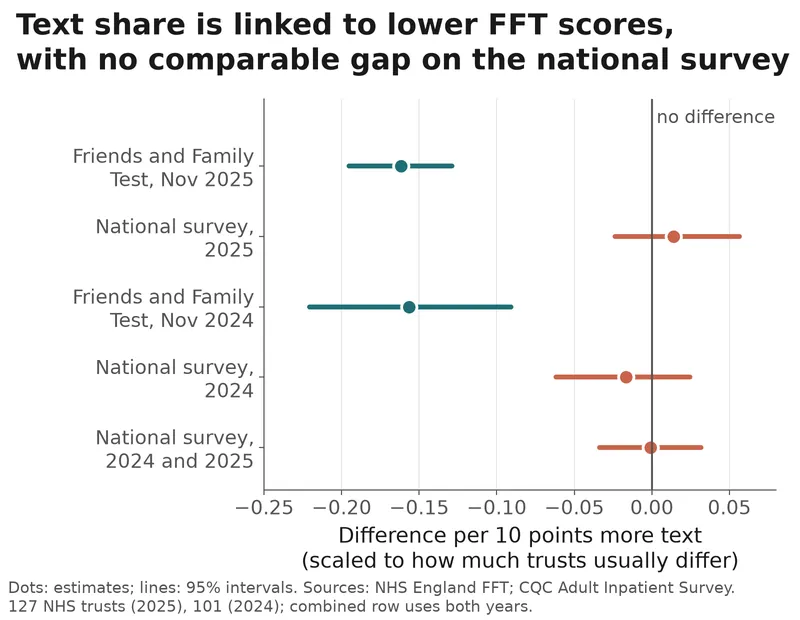
Could trusts that collect more of their FFT feedback by text simply be giving worse care? If they were, it should show up elsewhere too. The CQC’s national inpatient survey contacts patients the same way at every trust, though they can answer online or on paper and only about 37% reply. It asks patients to rate their overall experience from 0 to 10. The comparison used FFT scores for November, the month the survey sampled patients.
On the CQC survey, in 2025 and in 2024, there was no difference of comparable size between trusts that collected more of their FFT feedback by text and those that collected less. Taking each trust’s CQC score into account left the FFT gap almost unchanged. The gap between trusts fits differences in how FFT feedback is collected better than differences in patients’ experiences of care.
4. Consistent, but not the whole story
A trust’s FFT score is very consistent from month to month. When each trust’s year was split into alternate months, scores from the two halves correlated at 0.97. This means trusts keep similar positions from month to month, not that the score detects real change within a trust. And consistency alone doesn’t show accuracy. An archer whose arrows always land in the same spot is consistent, whether or not that spot is the bullseye.
FFT scores are related to CQC survey scores, but how strongly is uncertain. After accounting for random measurement error in both measures, the correlation was 0.44 in 2025 (95% interval 0.22 to 0.63) and 0.61 in 2024 (95% interval 0.39 to 0.77). That is a weak to moderate relationship in 2025 and a moderate to strong one in 2024. And as sections 2 and 3 showed, FFT scores are also linked to how feedback is collected.
In my view, that suggests FFT scores may be more useful for tracking one hospital over time, as long as it keeps the same collection method, than for comparing hospitals that collect feedback differently. NHS England’s own guidance already says the test is “not intended to provide data that can be used to compare different organisations”. That advice covers trusts using the same method too, partly because the data is not adjusted for case mix or patient demographics. These results add one more reason for that caution.
5. Limitations of this analysis
Why text-heavy trusts score lower. “How feedback is collected” covers two things this data cannot separate. Patients may find it easier to criticise care from home, away from the staff who looked after them. Or text messages and ward cards may simply reach different patients. Both could be happening. FFT data is published only as monthly totals, so it does not show who answered.
Which method gives the truer picture. Text might be the more candid method, or the less representative one, and these results cannot say which. A study that assigned patients to methods at random could show how much difference the method itself makes.
What happens when a hospital switches. Three trusts stopped using text during the year. Their results were mixed, and three trusts are too few to draw conclusions. An exploratory within-trust analysis, added after the main results were seen, compared each trust with itself month by month. This sets aside differences between trusts that stay the same through the year. Within a trust, months with a higher text share were also linked to lower scores. The estimates were smaller than between trusts, though the difference was not formally tested. So part of the gap between trusts may reflect other differences between them.
Cause and effect. Trusts chose their own methods, so this is a comparison between trusts, not an experiment.
6. How this fits with earlier work
The broad finding is not new. A study of 2013 FFT data from 32 hospitals, published online in 2014 by Picker Institute researchers, found that scores differed by how the test was administered, and by patients’ age and sex. They concluded: “Comparisons between organisations should be avoided.” In the United States, an experiment with the national hospital patient survey assigned patients at random to different survey methods. Some of the differences between methods were equivalent to more than 30 percentile points in hospital rankings. Because patients were assigned at random, those differences came from the survey method. What appears to be new here is evidence on text messages specifically, from current national data, with an independent survey as a check.
What to ask of any feedback score
Before relying on a feedback score, three questions are worth asking.
Was it collected the same way everywhere? If not, part of the difference between hospitals may come from how feedback was gathered.
Does it agree with an independent measure? Consistency alone does not tell you it is right.
Could it detect the change you care about? Scores already bunched near the top leave little room to register further improvement, even when care gets better.
How the data was analysed
Data: NHS England Friends and Family Test inpatient tables, August 2025 to July 2026 (133 NHS acute trusts; 2,072,201 responses), and CQC Adult Inpatient Survey trust results for 2024 and 2025. Questions, analyses and alternatives were fixed in advance, with any departures explained in the full report. They were set out in a written plan before any outcome results were seen, but not formally preregistered. The main analysis is a regression of each trust’s 12-month FFT score on its share of responses by text, adjusted for region, size and specialist status. It works on the log-odds scale, which suits percentages bunched near the top of the scale, and the results are converted back to percentage points. Intervals come from a bootstrap, resampling trusts 2,000 times, except in Figure 2, where they are approximate, and for both years combined in Figure 3, where standard errors are clustered by trust. Exploratory checks are labelled as such.
Limitations: comparisons between trusts are observational. In particular, how patients are asked cannot be separated from which patients answer. The CQC survey is the only independent measure, and deprivation was not measured directly. Trusts set up text collection differently, for example in timing, wording and reminders. Published scores may also influence which method trusts choose. The earlier one-month analysis of August 2026 data, looked at in October, prompted this one and is superseded here.
The full report, code and data sources are available on request.
Updated 16 November 2026: added 95% labels to intervals, a caveat on the size of the high-text versus low-text gap, and clearer wording in places. The findings are unchanged.
Sources: NHS England, Friends and Family Test data and FAQs (england.nhs.uk/fft). Care Quality Commission, Adult Inpatient Survey 2024 and 2025 (cqc.org.uk). Sizmur, S., Graham, C. and Walsh, J. (2015). Influence of patients’ age and sex and the mode of administration on results from the NHS Friends and Family Test of patient experience. Journal of Health Services Research & Policy, 20(1), 5–10. Elliott, M. N. et al. (2009). Effects of survey mode, patient mix, and nonresponse on CAHPS hospital survey scores. Health Services Research, 44(2), 501–518.